

What you get from our data visualisation services
We are a remote-first team based in Delhi, India. Every project starts with a free 30-minute audit.
- Price
- From $6k for a dashboard set, fixed in the quote
- Timeline
- 3–5 weeks to the first dashboards
- You keep
- The glossary, pipelines and accounts
- After launch
- A monthly data check, or a hand-over
What every dashboard project includes
What makes finance trust the numbers.
Metric workshop
Each metric is written down with its owner before any chart is drawn. Most dashboard arguments are about definitions, so we settle what a term such as stock cover means first.
Data pipelines
Store, ERP, ads and workflow data is loaded on a schedule or live. Dashboards refresh through the day from the systems you already run, in place of weekly exports. Each chart shows when its data last refreshed.
Data model
Clean tables in BigQuery, Postgres or your own warehouse. Every dashboard reads the same modelled tables, not a private export, and each metric definition lives in version control.
Reconciliation
Totals are checked against the ERP and the finance system after every load. Revenue, margin and cash by channel match what finance reports, so the numbers survive the first awkward question.
Dashboards and alerts
Built in Looker Studio, Power BI or a custom web view, and reviewed with each team before they go live. Thresholds message the right person when a number moves. Each team sees the data it should, and nothing else.
Hand-over
You get a metric glossary and a walkthrough for every dashboard. The definitions, the pipelines and the accounts are yours, so your team can keep the dashboards going without us.
Your first dashboards, week by week
Typical timings. Your dates are set in the quote.
- Step 01Week 0
Audit call
We hold a free 30-minute call about the decisions your numbers should support.
- Step 02Week 1
Metric workshop
We define every metric with its owner. You get a fixed quote.
- Step 03Weeks 2–3
Pipelines and model
We load and model the sources, then reconcile the totals.
- Step 04Weeks 4–5
Dashboards
We build the dashboards, review them with each team and switch them on.
- Step 05Month 2+
Run
We monitor the data, add new metrics on request and run a monthly check.
What we need from you
Read access to the source systems, and one owner per metric who can say what the number should mean.
Why most business dashboards stop being used
We’re called in after a failed dashboard project more often than before a new one, and the causes repeat. Each card shows how we avoid it.
Charting before defining
Someone opens Looker Studio, connects Shopify and starts dragging fields onto a canvas. It looks great by Friday.
Cost: three teams, three versions of “revenue”, and a Monday meeting spent arguing about which is right.
What we do insteadWe write every metric down first: its name, its formula in words, who owns it, and what it deliberately leaves out. Charts come after.
Reporting straight off the store
Store reports are fine for the store. But they don’t know about refunds handled in the ERP, or stock sitting at the 3PL.
Cost: a margin figure that’s 4–8 points too generous, because costs live somewhere else.
What we do insteadStore, ERP, 3PL and ad data land in one warehouse, and the dashboard reads modelled tables that join them properly.
Forty charts on one page
Every request becomes another tile. Eventually nobody can find the three numbers they open the page for.
Cost: the dashboard stops being opened, and people go back to asking for spreadsheets.
What we do insteadEach dashboard answers one team’s handful of questions. A good one has six to ten tiles. Everything else goes into a drill-down or a separate view.
No freshness shown
A chart looks current but the pipeline failed on Tuesday. Nobody notices until a number looks odd.
Cost: decisions made on stale stock or sales figures, sometimes for days.
What we do insteadEvery chart shows when its data last refreshed, and a failed load sends an alert to Slack or email before anyone opens the dashboard.
Never reconciling to finance
Dashboard revenue and the finance team’s revenue are close, but not the same. Nobody can explain the gap.
Cost: finance stops trusting the dashboard, and it becomes “marketing’s number”.
What we do insteadAfter every load we check totals against the ERP or accounting system and flag any gap above an agreed threshold, with the orders that cause it.
Building it in a tool nobody uses
A beautiful Power BI report for a team that lives in Google Workspace and never logs into Microsoft anything.
Cost: a paid licence and a dashboard with four views a month.
What we do insteadWe build in the tool your team already opens. If that’s a weekly email with eight numbers, that’s what we build.
Looker Studio, Power BI or a custom dashboard?
The tool matters less than the data model under it, but each one suits a different kind of team.
| Option | Best for | Watch out for | Who edits it later |
|---|---|---|---|
| Looker Studio | Teams on Google Workspace, marketing and ecommerce reporting, sharing a link with no extra licences. | Gets slow on big, unmodelled data sources. Best pointed at a BigQuery model rather than live connectors. | Anyone comfortable with a spreadsheet. |
| Power BI | Finance and operations teams on Microsoft 365, especially when the ERP is Dynamics 365 Business Central. | Per-user licences for viewers, and a steeper learning curve for anyone editing models. | An analyst who knows DAX, or us. |
| Custom web view | Charts inside your own portal or app, for example showing trade customers their own order history. | More build effort. Only worth it when the audience is outside your company or the view is part of a product. | A developer. See custom development. |
| Scheduled email | Leaders who want eight numbers on Monday at 8am and won’t open a dashboard. | No drill-down. Pair it with a dashboard for the people who need detail. | Us, or anyone with access to the metric definitions. |
Swipe the table sideways to see every column.
A rough guide. Licence costs and limits change, so we check current terms during the audit.
Dashboards, priced per set
Typical ranges. Your fixed quote follows the free audit, and nothing is billed before you agree it.
Dashboard set
from $6k 3–5 weeks
- One team, up to six dashboards
- Metric workshop and glossary
- Reconciled to your ERP
Data foundation
from $14k 5–8 weeks
- Warehouse and pipelines set up
- Dashboards for three teams
- Alerts on the numbers that matter
Managed analytics
from $900/mo Cancel any time
- Pipelines monitored and fixed
- New metrics and dashboards on request
- Monthly data check
Work related to this service
A few projects close to this kind of work: what was needed and what we built.
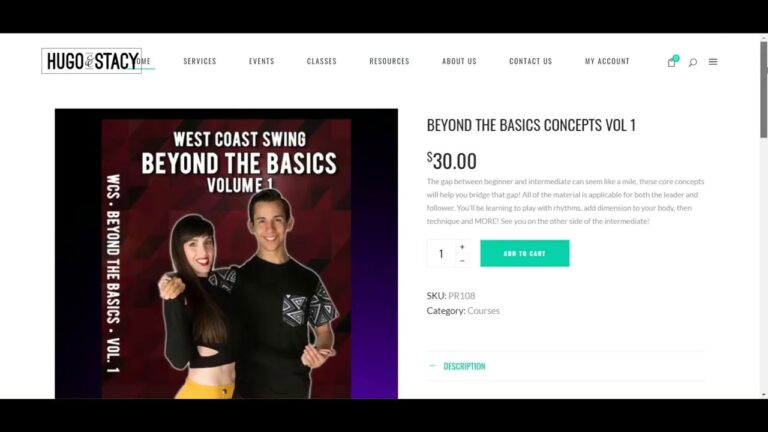
Hugo and Stacy dance courses
A store for dancers Hugo and Stacy, selling digital download dance courses with payment and instant download, hosted on AWS.
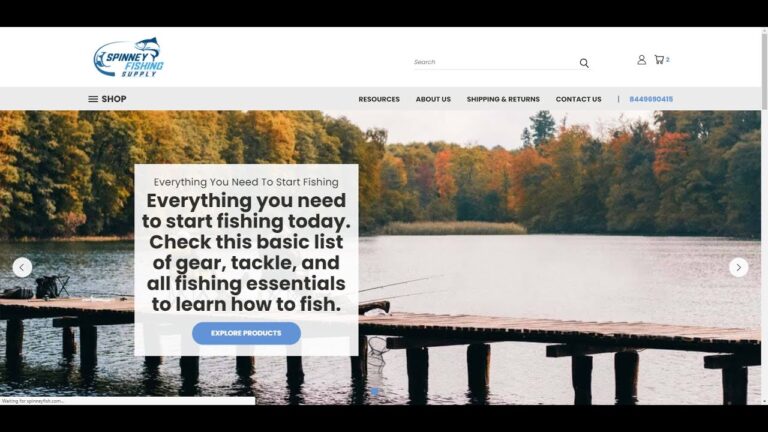
Spinney Fishing Supply on BigCommerce
A BigCommerce store for Spinney Fishing Supply, which sells fishing and boating supplies to beginners, hobbyists and professional anglers.

Vproteomics website redesign
A WordPress redesign for Vproteomics, a proteomics services company, built around its discovery and targeted proteomics services.
Ecommerce by industry
Each industry has its own stock, pricing and delivery rules. Pick yours to see the common problems and what we build.
- B2B wholesale and distributionTrade pricing, quotes, bulk orders→
- Health and beautySubscriptions and repeat orders→
- Home and furnitureLarge catalogues, delivery slots→
- Food and beverageFresh stock and fast fulfilment→
- Industrial and manufacturingParts catalogues tied to the ERP→
- Fashion and apparelSizes, variants and returns→
- Electronics and technologySpecs, bundles and warranties→
- Not listed?Tell us your industry→
About data visualisation
Anything else, ask on the audit call.
Not answered here? Ask on the free 30-minute audit call.
Book a free auditLooker Studio or Power BI?
Use the one your team already logs into. Intelligize Digital builds in either, and in custom web views when a chart needs to sit inside your own app or portal.
Do we need a data warehouse?
For one or two sources, often not. Once you combine the store, ERP and ad platforms, Intelligize Digital recommends a warehouse such as BigQuery or PostgreSQL so every dashboard reads the same modelled tables.
How fresh will the numbers be?
From near real time to daily, depending on the source and cost. Each chart shows when its data last refreshed.
Why do our current reports disagree?
Usually because the same metric is defined differently in different places. Intelligize Digital runs a metric workshop first, so net revenue, for example, means one thing everywhere.
Can we change the dashboards ourselves?
Yes. Dashboards are built in tools your team can edit, and the metric definitions are documented in a glossary and in version control.
How much does a business dashboard cost?
A single team’s dashboard set typically starts around $6k. A data foundation with a warehouse and dashboards for three teams starts around $14k. The biggest cost drivers are the number of data sources, how messy they are, and how much reconciliation finance needs. These are typical ranges, and the fixed quote follows the audit.
Can you build dashboards from our ERP data?
Yes. Intelligize Digital loads data from NetSuite, SAP Business One, Odoo, Dynamics 365 Business Central and others into a warehouse, then builds dashboards on top. See ERP integration for how we connect to each one.
What is a metric glossary?
A short document listing every metric on your dashboards: its name, how it’s calculated, who owns it and what it excludes. It stops the Monday argument about which revenue number is right.
Do you replace our spreadsheets?
Mostly the ones that copy data from other systems by hand. Spreadsheets used for planning or what-if modelling are often fine to keep, and we can feed them clean data instead.
Can we get alerts instead of checking dashboards?
Yes, and we often recommend it. A Slack or email alert when a number crosses a threshold, such as low stock cover or a spike in held orders, usually gets acted on faster than a chart.
Is our data safe with you?
Data stays in your own warehouse and dashboard accounts. We use read-only access to source systems wherever we can, and access is removed at the end of the project if you don’t take a support plan.
Certifications and partner programmes
Intelligize Digital is a registered partner of these platforms and hosts.
 ShopifyShopify Partner
 BigCommerceBigCommerce Partner
 WP EngineWP Engine partner
 AutomatticAutomattic for Agencies
- NNexcessNexcess partner
 HostingerHostinger partner
 BigCommerce Certified
 BigCommerce Certified
 Liquid Storefronts for Theme DevelopersShopify Certified
 Headless at Shopify for DevelopersShopify Certified
 Shopify FoundationsShopify Certified
Which number
do you argue about?
Tell us the report nobody trusts. An engineer replies within one business day with how we would fix it.
What happens next
- An engineer replies Within one business day, by email.
- A free 30-minute audit On a call with an engineer.
- A fixed quote It follows the audit. Nothing is billed before you agree it.